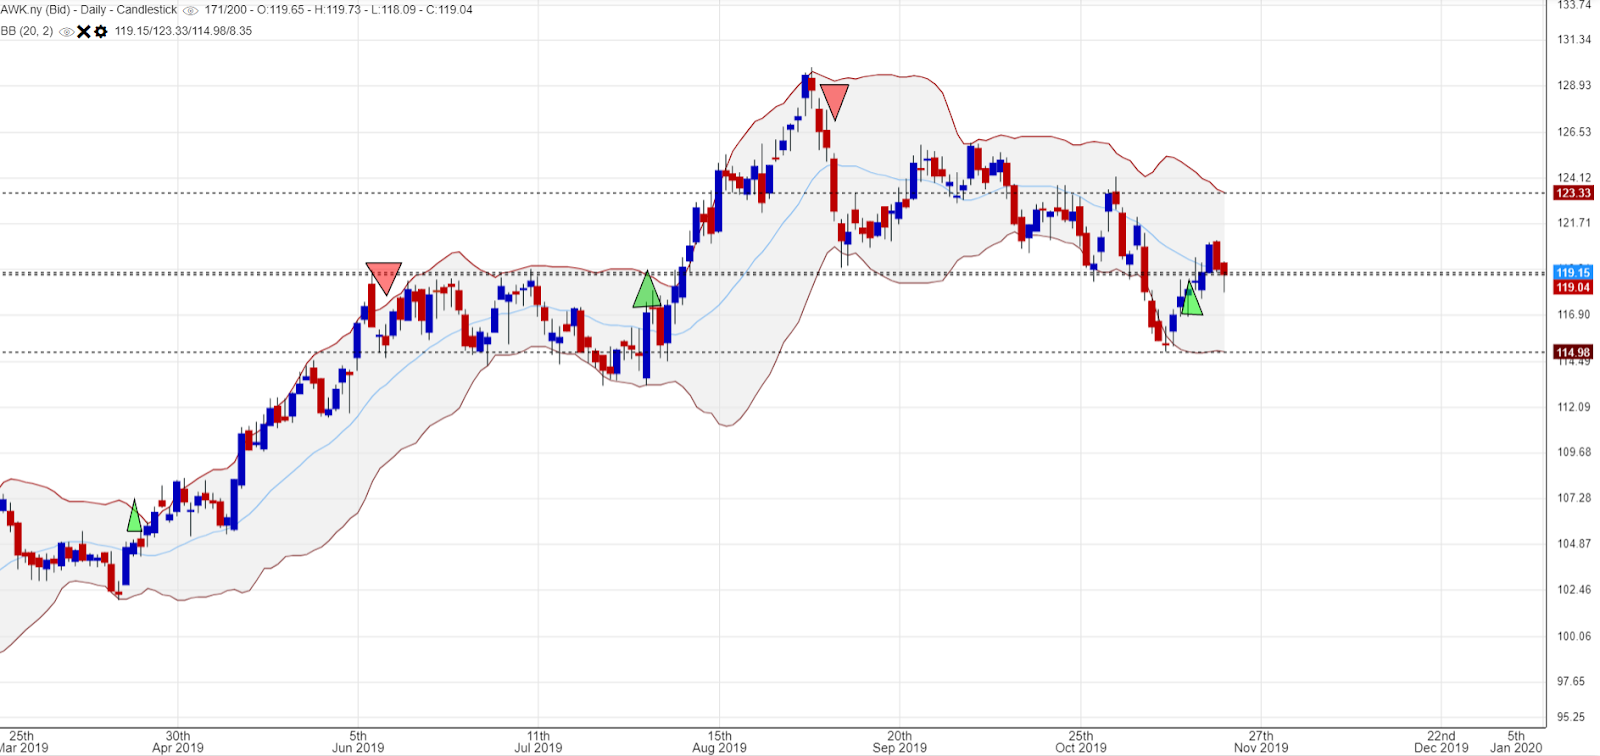
November BSI Stock: AWK (NYSE)

November BSI Stock: AWK (NYSE)
Buyer Strength Indicator gave three buy signals for this stock

Get BSI stocks in your email

Get BSI Stocks in your email

Real-time Headlines

Hot News

Forex and Commodities

Technical analysis

googleae94913f8a71cdc1.html

Wednesday, March 30, 2011

Why EUR/USD is not good to trade the rest of week 13 (March 28th-Apr 1st)

Traders and analysts will normally employ complex technical analysis to advice in which direction to go regarding a currency pair provided that a support/resistance level is broken, tested or none of the above. 

However, today I would like to use the same systems we implement to execute our orders, and provide advice, to actually tell why a particular pair is not a good candidate at all for trading this week.

We generated a sell signal on Monday March 28th at EUR/USD 1,4078 . Our order hit the SL at 1,4132 (above the volatility threshold for that timeframe of 50pips) and came back to hit the 1,4040 levels with indications of continuing the downtrend if it hits 1,4017 support. Some analyst estimate that the trend is upwards nonetheless and a break above 1,4115 will trigger further upward movement. To me, and with all due respect, this is like reading the horoscope (there is always something for everybody up or down). I honestly can’t see a clear direction on the EUR/USD going ahead this week and therefore I prefer to blunt out that this is not the best pair to trade. Period.

What to look for avoiding high risk trades:

RSI: fluctuating between 40 and 50 in the 4H chart. Depending what type of trader you are, in my case I use the 4H chart, but if you are a position trader (longer term) you can use the same analogy to a daily or weekly chart.

Price action: Open and Close near each other in the previous 10-15 periods. No clear indication of trend

34EMA wave: Simply flat

Optimal tracking filter: Inside the 34EMA wave which eliminates the chance for signal generation if you follow the Nutcracker system.


Real time example:

Notice the indecisive RSI as it matches the also vacilating price action. Trading during these conditions will only increase your heart rate

Tuesday, March 29, 2011

Update on signals from March 28th - Did you catch this trade?

If you followed the Nutcracker system you probably cashed in on this opportunity (see picture below). I did catch it, but this happened very early in my morning... I guess a trading robot would have not missed it...

The Nutcracker system issued a buy signal when the price crossed down on the 34 EMA high. Very quickly after that price action moved in our favor. However this is regarded as a short lived upward movement as the main trend is downward and there is no major indication that it will change soon.

Tuesday, March 22, 2011

About Expert Advisors (Forex Automated Systems)

I am new into Expert Advisors, I like to follow the charts, the price action and eventhough the rules for the system of my choice are not modified, I still like to have the feeling that I have the power to bend them. However I've been told so many stories about good results from using Expert Advisors (EAs) that I had to look into what solutions are out there and how I can apply them into my trading systems. I found some interesting one I would like to share with you here:

* Forex Market Trader V.2.0 (Expert Advisor)

* MetaTrader 4 (MT4) Expert Advisor - Free download through ad below - then click on "platforms":

Thursday, March 10, 2011

Position sizing revisited (The risk scale)

Reference to our previous post on the importance of position sizing, this post dives deeper into how to put this in practice. Basically we would like to find answer to these situations:

1.- When a trend is identified and I want to open a position, how much should I trade?

2.- What happens if another pair is also showing signs of entering a trend, how much should I buy/sell in relation to the first trade?

The concept of volatility:

We all know the very traditional concept of volatility in finance http://en.wikipedia.org/wiki/Volatility_(finance) , but I'd prefer to look at volatility in chemistry terms: “a measure of the tendency of a substance to vaporize”, the substance being your account capital. Volatility is a must understand concept when dealing with these questions. As the source of risk/reward, it will define how much risk I take when entering a trade or if it is “safer” to enter at all.

The best tool in my opinion for volatility measure is ATR. The ATR (Average True Range) "gauges the average range from low to high of each candlestick during its respective period of time". Now, ATR is commonly used to set stops. It is very common to see stops set at 2xATR. I would challenge this as it has no logical background (what happens in the market when the price is against you 2xATR?) the answer is: no one knows, but the price is just against your position. Instead, our stops are placed following other rules (see nutcracker system/rolling stone system).

However, the ATR can help us to find correlation between currency pair volatilities. But how? In your trade station take the amount of units required to move $0,01/pip (the minimum move per trade). Secondly take a look at the ATR for 15 periods associated to that currency pair and use this value as a volatility indicator for a stop loss in your trading station. The result will be a dollar amount of the instant volatility for that currency pair. Now take 1% of your account and divide it by the instant volatility in dollars. Do this for all currency pairs and you will get results like the one shown below.

Notice that the normalized units to trade based on its own volatility can be grouped in three. Basically for each 9 units I buy/sell of EUR/CAD I should buy/sell 18 units of USD/JPY
In our approach to a new trend, we will open a position with the minimum number of units possible, as the trend continues, we would increase the amount of units. Should a second trade be needed, we would enter it by referencing to the first trade.  The pairs in green are most likely in a trending state or showing no interesting price movement. The color codes do not mean likelihood of profitability. It tell us how to approach our entries with a risk management mindset.