
It is possible to observe very interesting behaviour on this curve, specially since it's main input are news mixed with technical indicators. It accurately describes what happens with the pair, and in some cases, can be a very helpful guide to describe "what to expect" as the trader sentiment is not something that changes lightly. It is a lagging indicator, that is for sure, however it has helped me greatly on my strategies (i.e. I would never trade against the main TSI direction.), but that is me, other traders might take the peaks of the TSI and trade against it for a short period, and still be very profitable.
 |
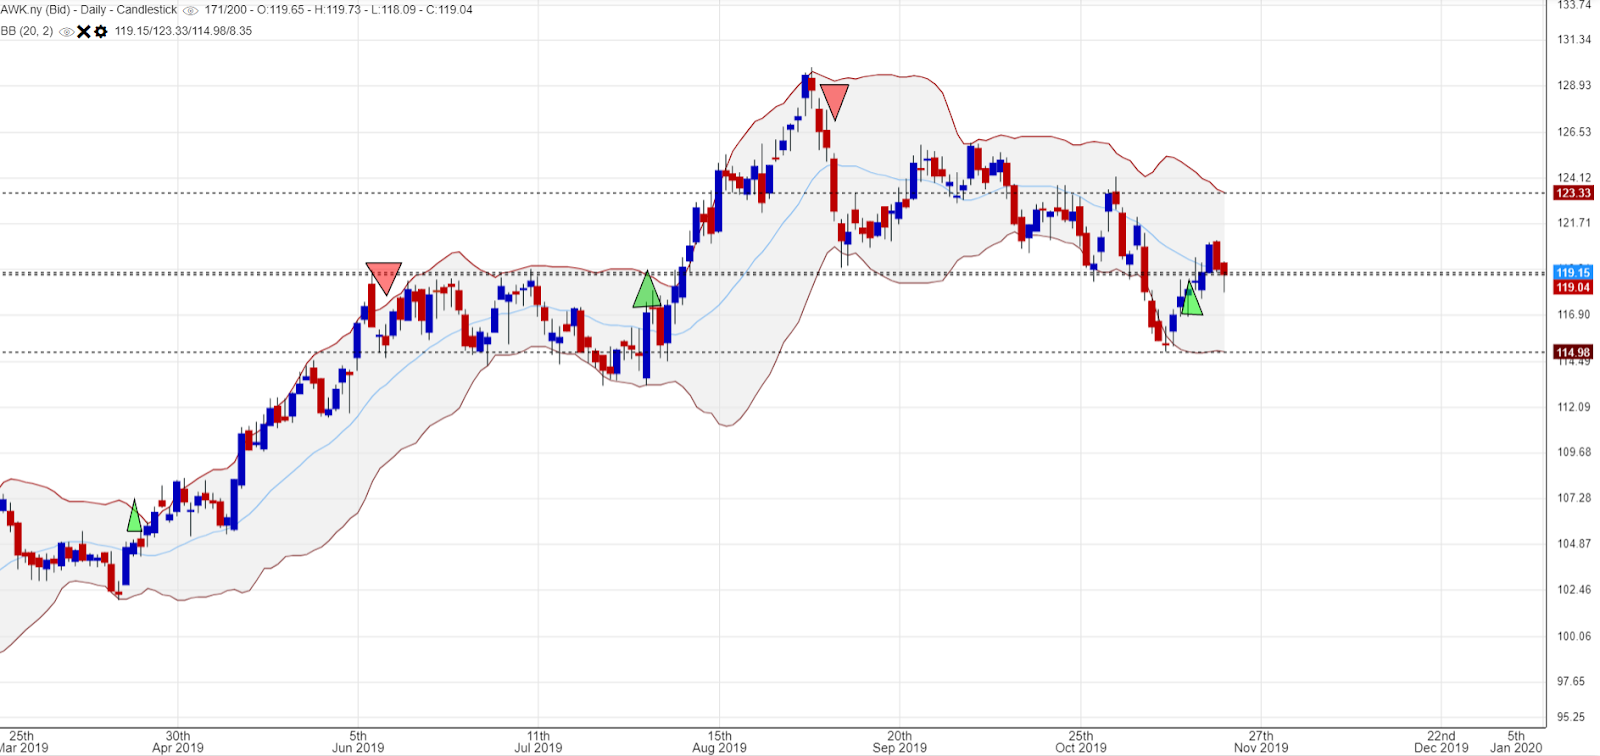
| Trend lines have been added to see when the trends are broken |

