
Updated strategy for shorter time frames
Our initial strategy is devised for a 4H period; however we have been asked about the possibility for it to be used on shorter time frames. Whilst this is certainly a possibility, one must acknowledge the challenges that this brings. To begin with, we need a stricter money management set up. This will be the focus of this update.
We will introduce a momentum based money management strategy based on MACD, and add Ichimoku clouds and Accumulative Swing Index (ASI) for trend confirmation. This will strengthen our basic Rolling Stone strategy. I will not dwell again on the definition of these technical indicators as they are available in all charting platforms and there are other blogs dedicated to them; however we will focus on how to use them in the context of our initial strategy.
Rules:
In the 30min chart:
End of update.
___________
In the 4H chart:
Our initial strategy is devised for a 4H period; however we have been asked about the possibility for it to be used on shorter time frames. Whilst this is certainly a possibility, one must acknowledge the challenges that this brings. To begin with, we need a stricter money management set up. This will be the focus of this update.
We will introduce a momentum based money management strategy based on MACD, and add Ichimoku clouds and Accumulative Swing Index (ASI) for trend confirmation. This will strengthen our basic Rolling Stone strategy. I will not dwell again on the definition of these technical indicators as they are available in all charting platforms and there are other blogs dedicated to them; however we will focus on how to use them in the context of our initial strategy.
Rules:
In the 30min chart:
Condition 1:
- Enter long:
- when the price breaks upwards the 60 periods (high) EMA and
- is out of the Ichimoku cloud and
- ASI is trending upwards for the last 3 periods smoothly. (no drastically choppy trending)
- Confirm that MACD is trending in the same direction and volume is up.
- Place stop 10 pips below the 60EMA Low
- Enter short when the same conditions occur in the opposite manner.
- when the price breaks downwards the 60 periods (low) EMA and
- is out of the Ichimoku cloud and
- ASI is trending downwards for the last 3 periods smoothly. (no drastically choppy trending)
- Confirm that MACD is trending in the same direction and volume is up.
- Place stop 10 pips above the 60EMA High
 |
| Buy signal generated as price closes outside the Ichimoku cloud and the 60EMA high. MACD also confirms substantial volume building up momentum. Accumulation Swing Index shows a steady uptrend confirming the trend also seen in the price chart. Stop loss is placed right below the 60EMA low. |
 |
| Sell signal generated by the system when the price closes below the Ichimoku cloud and the 60EMA low. Confirmation is sought against ASI and MACD for momemtum and trending conditions favor the odds of this being a successful trade. |
End of update.
___________
In the 4H chart:
Condition 1:
- Enter long when the price breaks upwards the 60 periods (high) EMA.
- Enter short when the price breaks low on the 60 periods (low) EMA.
Condition 2:
- Confirm trend with RSI 30 periods. Do not enter if RSI is in the 40-50 range (no trend). Increase your position size short if RSI is consistently lower than 40, and/or long if RSI is consistently greater than 50
- Use the bands as a stop loss or exit profit as prices trend opposite to your position. Enter a new position in the opposite direction when condition 1 is met. Use 2xATR as a reference.
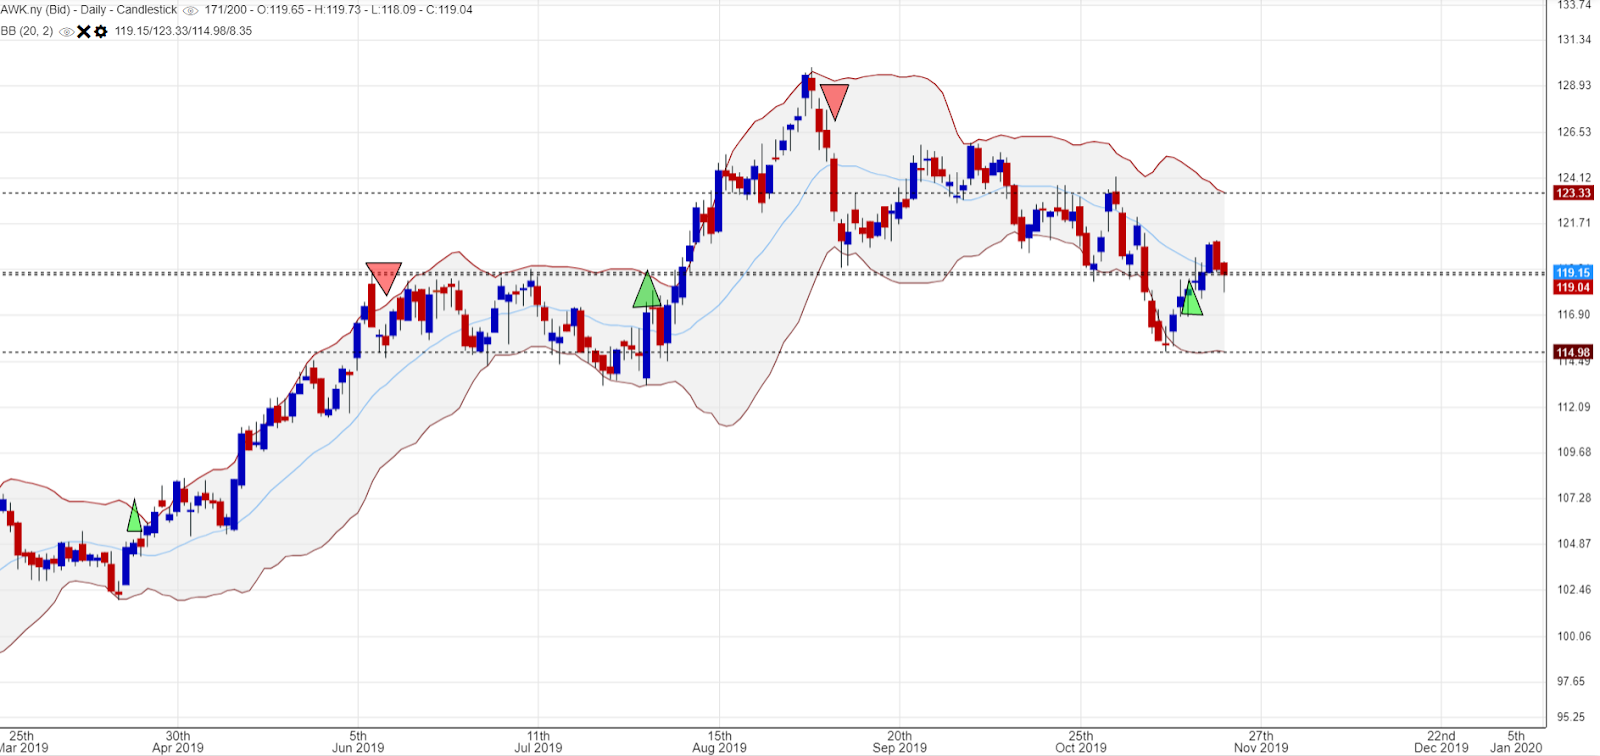
Important! Locking profits or/and avoiding unnecessary losses:
Exit half of your position once the full body of a candle stick is inside the bands as it moves in the opposite direction to your position. Close the remaining half if exceeds the opposite 60 periods EMA, then enter in the opposite direction if condition 1 is met. Avoid trading if prices are moving inside the bands or pairs that tend to show this behaviour (e.g. USD/CAD)
 |
| Rolling Stone trading system: take advantage of large trends with pre-defined Stop losses to minimize the phsycological effects of volatility. The system allows to exit half of the position to lock profits, while riding the last half. Notice the RSI values trending as well. In choppy markets, the RSI will linger between 40 and 50. It is recommended not to initiate any position with RSI values in that range, however, a nominal position can be initiated to monitor the pair. |